Flowscape
Flowscape draws the whole cluster's network traffic as one 3D scene: namespaces as platforms, workloads as lights, every conversation an arc with sparks coloured by verdict. Hubble UI shows one namespace at a time; this answers "who talks to whom across namespaces, and what would a policy have dropped" in one picture. Its upstream is the user's own repository, and it deploys as plain manifests around that image, per Conventions → Official upstream sources only.
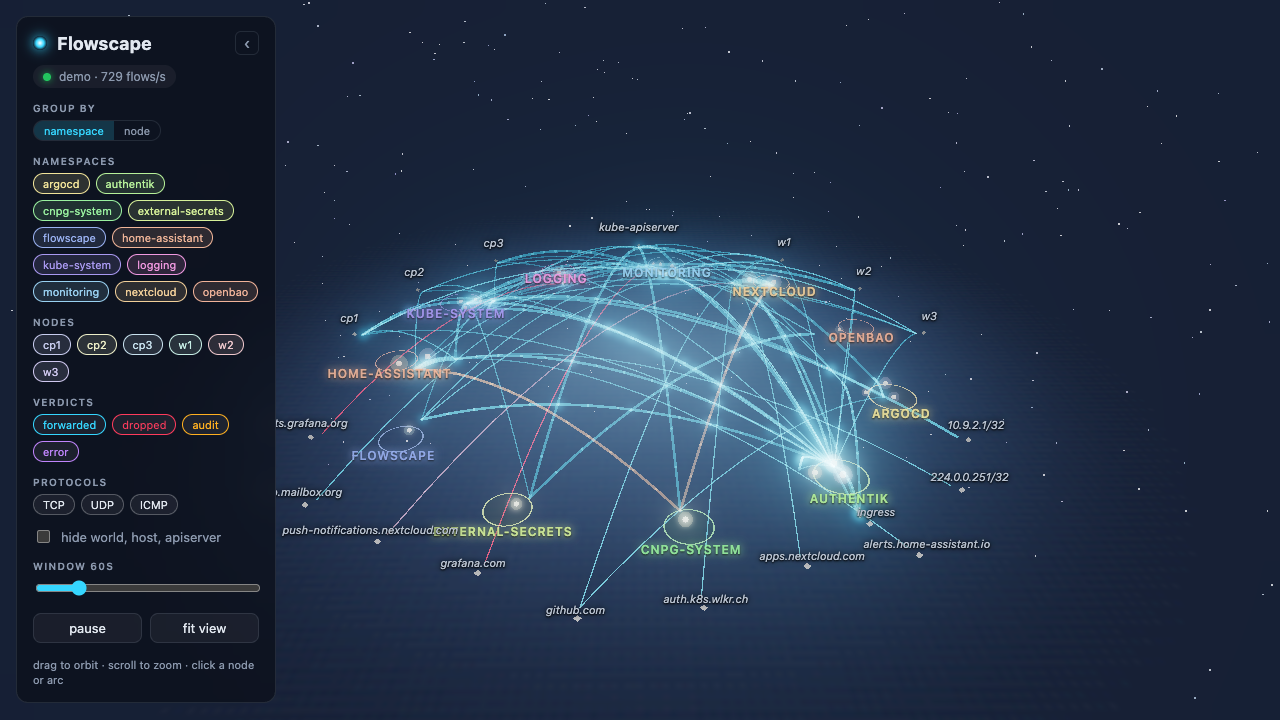
At a glance
| URL | flowscape.k8s.wlkr.ch; a live demo with a synthetic cluster runs in the browser |
| Authentication | Authentik proxy outpost; the app has none of its own |
| Storage | None. Five minutes of counters in memory, rebuilt from Relay on every start |
| Database | None |
| Reads | Hubble Relay in kube-system, plaintext gRPC on the pod port |
| Files | flowscape/ |
Configuration
| Setting | Why |
|---|---|
| Plain manifests, no chart | One stateless process with one port; the application repository lists what any deployment needs, and that is all there is |
The namespace enforces restricted |
The image is distroless, runs as uid 65532, writes nothing and needs no capability, so the strictest profile costs nothing |
automountServiceAccountToken: false |
The flow metadata already carries namespace, workload, identity, ports and verdict; the app never talks to the API server, so it holds no token |
HUBBLE_RELAY_ADDR on the Service port |
Relay's Service maps 80 to the pod's 4245 and serves plaintext: the Cilium chart enables TLS only on the agent leg by default. The network policy names the pod port because policy sees the backend, not the Service |
ALLOWED_ORIGINS is the hostname |
The WebSocket accepts only browsers that loaded the page from flowscape.k8s.wlkr.ch; anything else is refused before the socket opens |
| Readiness ignores the Relay connection | The outpost turns a failing readiness probe into a 502 on the whole site. A Relay outage shows as a red status pill in the UI and flowscape_relay_connected 0 in Prometheus instead, so the page stays up to say what is wrong |
revisionHistoryLimit: 2 |
Superseded ReplicaSets keep their Trivy config-audit reports until garbage collection; the default keeps ten |
HTTPRoute targets authentik-server, not the app |
Every flow in the cluster, with pod names, ports and request paths, is visible in the UI; the outpost authenticates before the request reaches it. The cross-namespace backendRef works only because the platform's referencegrant.yaml names this namespace. Pointing the route at the Service instead silently removes the whole authentication layer, so it deserves a second look in review |
Network policy
Every rule in flowscape/networkpolicy.yaml, and why it is there. The shape
is Conventions → Ship a CiliumNetworkPolicy;
rollout and debugging are in
Security Policies.
| Rule | Why |
|---|---|
Ingress on 8080 from the Authentik server pods only, with an L7 http rule |
The outpost is the only path to the UI, and the WebSocket upgrade passes the proxy the same way Home Assistant's does. No fromEntities: ingress, so a request straight from the Gateway cannot skip the login |
Ingress from Prometheus on 8080, GET /metrics only |
The metrics share the port with the UI; the path match keeps the scraper away from /api and /ws |
Egress to hubble-relay in kube-system on 4245 |
The one thing the app dials. The matching ingress rule on Relay's own policy lives in the platform repository, so reading every flow in the cluster is deliberately a change on both sides |
No toFQDNs, no kube-apiserver |
Nothing outside the cluster and no API access are needed; the absence is the point |
Usage
| Control | Effect |
|---|---|
| Drag, scroll | Orbit and zoom; the scene auto-rotates until the first drag |
| Group by | Platforms are namespaces or cluster nodes; the switch animates the regrouping, and in node view the arcs between platforms are the traffic that crosses the WireGuard mesh |
| Node chips | Hover to highlight the workloads on that machine, click to hide them; a red dot marks a node Hubble Relay cannot reach |
| Click a light or an arc | Counters, rates over the window, ports, HTTP paths and DNS names seen at L7, drop reasons, a sparkline |
| Namespace chips | Hide a namespace; alt-click shows only that one |
| Verdict and protocol chips | Hide arcs and sparks of that kind |
| Window slider | 10 s to 5 min; rates and the sparkline follow |
space, f |
Pause, fit the ring into the view |
world is split by the name the Hubble DNS proxy resolved, so an arc to
github.com and one to smtp.mailbox.org are distinct. kube-apiserver and
ingress sit on the outer ring; the Gateway's Envoy is ingress, which is
why user traffic arrives from there. The cluster's nodes sit at the back of
that ring under their own names: a flow's reporting agent places the pod on
its node, and the host and remote-node identities resolve to the machine
once one flow there has shown its address as host. Nothing is read from
the API server for this.
Without the cluster, the same binary runs on a laptop with --demo or replays
a capture; the README has
both.
Health check
kubectl -n flowscape get pods
kubectl -n flowscape port-forward deploy/flowscape 8080:8080 &
curl -s localhost:8080/api/status
The image is distroless, so there is no shell to exec into, and the route
answers with Authentik's login, so the status endpoint is read through a
port-forward.
status.relay should read connected with an empty unavailable list. In
Grafana, flowscape_relay_connected and flowscape_relay_unavailable_nodes
say the same over time, and rate(flowscape_flows_received_total[5m]) should
sit in the hundreds per second.
Pitfalls
Amber means audited, not blocked
With policyAuditMode on, a policy that would deny a flow logs an AUDIT verdict and lets it through. Amber arcs are exactly the conversations that break the day audit mode is switched off — see Security Policies → Rollout. Red arcs are real drops.
- It is live, not history. Relay's buffer is minutes deep and the app keeps five minutes; the record of what a policy refused last week is in Loki, via the Hubble export the platform tails.
- The status pill, not the pod, reports a Relay outage. Readiness stays
green on purpose (see Configuration), so
kubectl get podslooks fine while the scene is empty. Check/api/statusor the metric. - Sparks are a sample. The server sends at most 200 flow events per second per browser and the browser adds synthetic ones in proportion to the rate; the counters in the panel are exact, the particles are not.